Wednesday, February 18, 2015

Unit 3

Unit 3 Economics

Aggregate Demand (AD): shows the amount of Real GDP that the private, public and foreign sector collectively desire to purchase at each possible price level. 
- The relationship between the price level and the level of Real GDP inversely related 
- Curve goes downward

Three Reasons why AD is Downward Sloping
1) Real-Balances Effect: when the price level is high households and businesses cannot afford to purchase as much output
- when the price level is low, households and businesses can afford to purchase more output 
2) Interest-Rate Effect: a higher price level increases the interest rate which tends to discourage investment. 
- A lower price level decreases the interest which tends to encourage investment. 
3) Foreign Purchases Effect: A higher price level increases the demand for relatively cheaper imports
- A lower price level increases the foreign demand for relatively cheaper US exports

Shifts in Aggregate Demand (AD)
- there are two parts to a shift in AD:
   - A change in C, Ig, G, and/or Xn
   - A multiplier effect that produces a greater change than the original change in the 4 components

Determinants of AD:
1) Consumption: household spending is affected by:
- consumer wealth (more wealth = more spending, AD Shifts right) (less wealth = Less. Spending, AD shifts left)
- Consumer Expectations (positive expectations = more spending,AD shifts right, negative expectations = less spending, AD shifts left)
- Household Indebtedness
   - less debt = more spending, AD shifts right
    - more debt = less spending, AD shifts left
- Taxes
   - less taxes = more spending, AD shifts right
   - more taxes = less spending, AD shifts left

2) Gross Private Investment:
- Investment Spending is sensitive to:
   - The Real Interest Rate
       - Lower Real Interest Rate = More Investment, AD shifts right
       - Higher Real Interest Rate = Less
 Investment, AD shifts left
    - Expected Returbs
       - higher expected returns = more investment, AD shifts right
       - lower expected returns = less investment, AD shifts left
       - Expectrd Returns are influenced by expectations of future profitability, technology, degree of excess capacity (existing stock of capital), business taxes)

3) Government Spending
- more government spending shifts AD right
- less government spending shifts AD left

4) Net Exports
- Net exports are sensitive to
- Exchange Rates (International Value of $)
   - Strong $ = more imports and fewer exports, AD shifts left
   - Weak $ = fewer imports and more exports, AD shifts right
- Relative Income
   - String Foreign Economics = More Exports, AD shifts right
   - Weak foreign economies = less exports, AD shifts left 

Aggregate Supply: The level of Real GDP
Long-Run: Peruod of time where input prices are completely flexible and adjust to changes in price level
- In the long run, the level of real GDP supplied is independent of the price level
Short Run: Period of time where input prices are sticky and do not adjust to changes in the price level
- the level of Real GDP a supplied is directly related to the price level 

LRAS: marks the level of full employment in the economy (analogous to PPC) 
- because input prices are completely flexible in the long-run, changes in price-level do not change firms' real profits and therefore do not change firms' level of output. This means that the LRAS is vertical at the economy's level of full employment

SRAS: Because input prices are sticky in the short-run, the SRAS is upward sloping. this rejects the fact that in the short run, increases in the price level increase firm's profits and create incentives to increase output.

Changes in SRAS:
- an increase in SRAS a is seen as a shift to the right. Decrease is shift to the left
- The key to understanding shifts in SRAS is per unit cost of production
* (Per-unit production cost) = (total input cost) / (total output)

Determinants of SRAS (all of the following affect unit production cost):
1) input prices
2) productivity
3) legal institutional environment

Input Prices
- Domestic Resource Prices
   - Wages (75% of all business costs)
   - Cost of capital
   - Raw Materials (commodity prices)
- Foreign Resource Prices
   - Strong $ = lower foreign resource prices
   - Weak $ = higher foreign resource prices
- Market Power
   - Monopolies and cartels that control resources control the price of those resources 
- Increases in resource Prices = SRAS shifts left
- Decreases in Resource Prices = SRAS shifts right 

Productivity
- (Productivity) = (total output) / (total inputs)
- More productivity = lower unit production cost = SRAS shifts right
- Lower productivity = higher unit production cost = SRAS shifts left

Legal-Institutional Environment  
- Taxes and Subsidies:
   - Taxes ($ to govt) on business increase per unit production cost = SRAS shifts shifts left
   - Subsidies ($ from govt) to business reduce per unit production cost = SRAS shifts right
- Government Regulation
   - Government regulation creates a cost of compliance = SRAS shifts left
   - Deregulation reduces compliance costs = SRAS shifts right


2/17
Full Employment equilibrium exists where AD intersects SRAS & LRAS at the same point. 
- A recessionary gap exists when equilibrium occurs below full employment output. 
- Anytime you're in a recession or recessionary gap, AD is shifting to the left (decreasing)
- An inflationary gap exists when equilibrium occurs beyond full employment output. AD shifts to the right (increase)

Investment: money spent or expenditures on: new plants (factories), capital equipment (machinery), technology (hardware & software), new homes, inventories (goods sold by producers)

Expected Rates of Return:
1) How does business make investment decisions? Cost/Benefit Analysis
2) How does business determine the benefits? Expected rate of return
3) How does business count the cost? Interest costs
4) How does business determine the amount of investment they undertake? Compare expected rate of return to interest cost. If expected return > interest cost, then invest. If expected return < interest cost, do not invest. 

Real (r%) vs Nominal (i%)
- Nominal is the observable rate of interest. Real subtracts out inflation (pi%) and is only known ex post facto. 
r% = i% - pi%
- What then, determines the cost of an investment decision? The real interest rate (r%)

Investment Demand Curve (ID)
- What is the shape of the investment demand curve? Downward sloping
- Why? When interest rates are high, fewer investments are profitable; when interest rates are low, more investments are profitable. 

2/18
Shifts in Investment Demand (ID):
1) Cost of Production
- Lower costs shift ID right
- Higher costs shift ID left
2) Business Taxes
- Lower business taxes shift ID right
- Higher business taxes shift ID left
3) Technological Change
- New technology shifts ID right
- Lack of technological change shifts ID left
4) Stock of Capital
- If an economy is low on capital, then ID shifts right
- If an economy has much capital, then ID shifts left 
5) Expectations
- Positive expectations shift ID right
- Negative expectations shift ID left

Long-Run Aggregate Supply
- LRAS curve represents a point on an economy's production possibility curve. 
- The LRAS is a vertical line at an output level that represents the quantity of goods and services a nation can produce over a sustained period using all of its productive resources as efficiently as possible. 
- LRAS is always at full employment. It does not change as the price level changes. 
- LRAS shifts outward if there is a change in technology, a change in resource, or if there is economic growth.


2/20:
Disposable Income: income after taxes or net income. 
DI = Gross Income - Taxes
- With disposable income, households can either:
1) Consume (spend money on goods & services)
2) Save (not spend money on goods & services)

Consumption:
- Household spending
- The ability to consume is constrained by:
   - The amount of disposable income
   - The propensity to save
- Do households consume if DI = 0?
   - Autonomous consumption
   - Dissaving
- APC = C/DI = % DI that is spent

Saving:
- Household NOT spending
- The ability to save is constrained by:
   - The amount of disposable income
   - The propensity to consume
- Do households save if DI = 0?
   - NO
- APS = S/DI = % DI that is not spent

APC & APS
- APC + APS = 1
- 1 - APC = APS
- 1 - APS = APC
- APC > 1 .: Dissaving
- -APS .: Dissaving

MPC & MPS
- Marginal Propensity to Consume
   - Change in C / Change in DI
   - % of every extra dollar earned that is spent
- Marginal Propensity to Save
   - Change in S / Change in DI
   - % of every extra dollar earned that is saved
- MPC + MPS = 1
- 1 - MPC = MPS
- 1 - MPS = MPC

The Spending Multiplier Effect
- An initial change in spending (C, Ig, G, Xn) causes a larger change in aggregate spending, or Aggregate Demand (AD). 
- Multiplier = Change in AD / Change in Spending
- Multiplier = Change in AD / Change in C, Ig, G, or X
- Why does this happen? Expenditures and income flow continuously which sets off a spending increase in the economy. 
- The Spending Multiplier can be calculated from the MPC or the MPS
- Multiplier = 1 / (1-MPC) or 1/MPS
- Multipliers are (+) when there is an increase in spending and (-) when there is a decrease. 

Calculating the Tax Multiplier
- When the government taxes, the multiplier works in reverse
- Why? Because now money is leaving the circular flow. 
- Tax Multiplier (note: it's negative)
   = -MPC/(1-MPC) or -MPC/MPS
- If there is a tax-CUT, then the multiplier is + because there is now more money in the circular flow

2/25
Fiscal Policy: Changes in the expenditures or tax revenues of the federal government
2 Tools of fiscal policy:
- Taxes: Government can increase or decrease taxes
- Spending: Government can increase or decrease spending 

Deficits, Surpluses, & Debt
- Balanced Budget: Revenues = Expenditures
- Budget Deficit: Revenues < Expenditures
- Budget Surplus: Revenues > Expenditures
- Government Debt: (Sum of all deficits) - (Sum of all surpluses)
- Government must borrow money when it runs a budget deficits
- Government borrows from: individuals, corporations, financial institutions, foreign entities or foreign governments 

Fiscal Policy Two Options
- Discretionary Fiscal Policy (action)
   - Expansionary fiscal policy - think deficits (recession)
    - Contractionary fiscal policy - think surplus (inflationary period)
- Non-Discretionary Fiscal Policy (no action)

Discretionary v. Automatic Fiscal Policies
- Discretionary: Increasing or decreasing government spending and/or taxes in order to return the economy to full employment. Discretionary policy involves policy makers doing fiscal policy in response to an economic problem. 
- Automatic: Unemployment compensation and marginal tax rates are examples of automatic policies that help mitigate the effects of recession and inflation. Automatic fiscal policy takes place without policy makers having to respond to current economic problems.

Contractionary vs. Expansionary Fiscal Policy
- Contractionary fiscal policy - policy designed to decrease aggregate demand
   - strategy for controlling inflation
- Expansionary fiscal policy - policy designed to increase aggregate demand
   - strategy for increasing GDP combating a recession & reducing unemployment 

Expansionary Fiscal Policy
- Increases government spending
- Decrease taxes 

Contractionary Fiscal Policy
- Decrease government spending
- Increase taxes

Automatic or Built-In Stabilizers
- Anything that increases the government's budget deficits during a recession and increases its budget surplus during inflation without requiring explicit action by policy makers. 

Nondiscretionary Fiscal Policy (Automatic Stabilizers)
1) Transfer Payments
     - Welfare checks
     - Food Stamps
     - Unemployment checks
     - Corporate dividends
     - Social Security
     - Veteran's benefits

Progressive Tax System: Average tax rate (tax revenue/GDP) rises with GDP
Proportional Tax System: Average tax rate remains constant as GDP changes
Regressive Tax System: Average tax rate falls with GDP

Friday, January 30, 2015

Unit 2

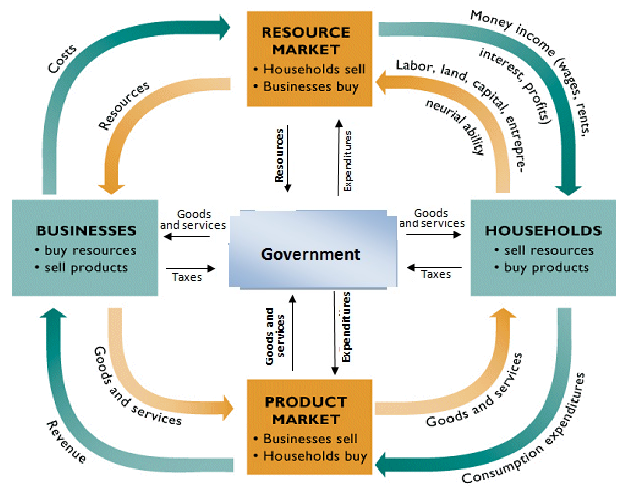
Circular flow model
- represents the transactions in an economy
- 4 Types: Traditional, mixed, capital, command
- Capital (free market, free enterprise):
- All goods and services flow in a clockwise direction
- Two markets: product market and factor market
- Product market; this is the place where goods and services are produced by businesses and are bought and sold to households 
- Resource/Factor Market: this is the place where households sell resources and businesses buy resources.


3 Economic Factors
- Households: this is where you have a person or group of people that share their income
- Government
- Firm: organization that produces goods and services for sale. 

Unit 2 Part 2 (1/27)

National Income Accounting: Economists collect statistics on production, income, investment, and savings.

Expenditure Approach: this is where we are adding up the market value of all domestic expenditures made on all final goods and services in a single year. 
• C + Ig + G + Xn = GDP

Income Approach: we are adding all the income earned by households and firms in a single year. 
• W + R + I + P + Statistical Adjustments
   Wages, rents, interest, profit (proprietor's income)
• wages: compensation  of employees or salary
• Rent: from tenants to landlords or from lease payments that corporations pay for the use of space 
• Interest: money paid by private businesses to the suppliers of loans used to purchase capital 
• Profit (corporate income taxes, dividends, undistributed corporate profits)

GDP (Gross Domestic Product): the total dollar value of all final goods and services produced within a country's borders within a given year.

   Included in GDP:
   C + Ig + G + Xn
    Consumption: takes up 67% of the economy. Includes final goods and services.
     Ig: gross private domestic investment
          1) Factory Equipment Maintenance
          2) New factory equipment
          3) Construction of housing
          4) Unsold inventory of products built in 
               a year. 
     G: Government Spending (military,  school, etc)
     Xn: Net Exports (Exports - Imports)

    Not included in GDP:
    1) used or secondhand goods
    2) Intermediate Goods: goods and services that are purchased for resale or for further processing or manufacturing. (multiple counting error)
    3) Non-Market Activities (volunteer work, babysitting, illegal drug sales, bartering, trading, underground activities, etc.)
    4) Financial Transactions (stocks, bonds, real estate) 
    5) Gifts or transfer payments
        • Public transferred payment is where recipients contribute nothing to the current production (social security, welfare payments, etc)
        • Private transferred payments produces no output. It is simply transferring funds from one individual to another.  (Scholarships, Christmas gifts)
     6) foreign

Unit 2 Part 3 (1/28)

Budget: Government Purchases of Goods & Services + Government Transferred Payments - Government Tax & Fee Collections
- If # is positive, you have a budget deficit
- If # is negative, you have a budget surplus

NI (National Income): NDP - Indirect Business Taxes - Net Foreign Factor Income
OR GDP - Indirect Business Taxes - Depreciation - Net Foreign Factor Income
OR Compensation of Employees + Rental Income + Interest Income + Proprietor's Income + Corporate Profits

PI (Personal Income): NI - Social Security Contributions - Corporate Income Taxes - Undistributed Corporate Profits + Transfer Payments

DI (Disposable Income): PI - Personal Taxes
OR NI - Personal Household Taxes + Government Transfer Payments

NNP (Net National Product): GNP - Depreciation

NDP (Net Domestic Product): GDP - Depreciation

GNP (Gross National Product): it is a measure of what its citizens produced and whether they produce these items and whether they produce these items within its borders
• GDP + Net Foreign Factor Income

Nominal GDP: the value of output produced in current prices. It can increase from year to year if either output or price increases. 

Real GDP: the value of output produced in base year or constant prices. It is adjusted for inflation. It can increase from year to year only if output increases. 
Base Year Price x Quantity
Base year is given or is the earliest year. 

REAL OR NOMINAL: Price x Quantity

Price Index: a measure of inflation by tracking changes in a market basket of goods compared with that in a base year 
• (price of market basket of goods in current year) / (price of market basket of goods in base years) x 100

GDP Deflator: it is a price index used to adjust from nominal GDP to real GDP
- In the base year, GDP deflator is equal to 100. For years after the base year, GDP deflator is greater than 100. For years before the base year, GDP deflator is less than 100. 
• (Nominal GDP) / (Real GDP) x 100

Inflation: (New GDP Deflator - Old GDP deflator) / Old GDP Deflator x 100

Unit 2 Part 4 (2/2)

I. Inflation: a rise in the general level of prices. 

II. Measuring Inflation (Standard is 2-3%)
    A) Inflation Rate: measures the percentage increase in the price level over time. Offers a key indicator of the economy's health. 
         a) Deflation: Decline in the general price level. 
         b) Disinflation: Occurs when the inflation rate declines. Price has raised, but not back to the original price. 
     B) Consumer Price Index (CPI): Measures inflation by tracking the yearly price of a fixed basket of consumer goods and services. Indicates changes in the price level and cost of living. 

III. Solving Inflation Problems
     A) Finding inflation rate using market basket data: (current year market basket value) - (base year market basket value) / (base year market basket value) x 100
     B) Finding inflation rates using price indexes: (current year price index) - (base year price index) / (base year price index) x 100
     C) Estimating inflation using the rule of 70: Rule of 70: used to calculate the number of years it will take for the price level to double at any given rate of inflation. 
(Years needed to double inflation) = 70 / (annual inflation rate) 
     D) Determining Real Wages. (Real wages) = (nominal wages) / (price level) x 100
     E) Finding Real Interest Rate: (Nominal Interest Rate) - (Inflation Premium)
         a) Real Interest Rate: the cost of borrowing or lending money that is adjusted for inflation (expressed as a percentage) 
         b) Nominal Interest Rate: the unadjusted cost of borrowing lending money

IV. Causes of Inflation
     A) Demand-Pull Inflation: caused by an excess of demand over output that pulls prices upward (ex. closer you are to the center of a concert, the higher the prices)
     B) Cost-Push Inflation: caused by a rise in per unit production cost due to increasing resource cost (ex. Airplane costs rise because gas goes up)
V. Effects of Inflation
    A) Unanticipated: unaware
    B) Anticipated

Helped by Inflation: Borrowers. Debt will be repaid with cheaper dollars than those that were loaned out. 
Hurt by Inflation: Fixed Income, Savers, lenders & creditors (when they get their money back, the money is worth less than what was borrowed) 

Unit 2 Part 4 (2/3)

Unemployment: the percentage of people who do not have jobs that are in the labor force 

Unemployment Rate: (# of unemployed) / (# of unemployed + # of employed) x 100

Ideal unemployment rate: 4-5% 

Labor Force: the number of people in a country that are classified as either employed or unemployed

Not in the Labor Force:
1) Children
2) Military Personnel
3) Mentally Insane
4) Incarcerated People
5) Retirees 
6) Stay at home parents
7) Full-Time Students
8) Discouraged Workers (those who look for a job but cannot find one)

Types of Unemployment
1) Frictional: people who are between jobs, usually because they choose new opportunities, new choices, new lifestyles, or perhaps new educational levels
2) Seasonal: waiting for the right season to go to work. Ex. Santa Claus, Construction Workers, Life Guards
3) Structural: technology changing, associated with lack of skills or a declining industry. Ex. NASA, typewriter technicians
4) Cyclical: Unemployment that occurs due to a swing in the economy. Associated with the business cycle. Trough or contractionary period 

Full Employment: occurs when there is no cyclical unemployment present in the economy. 4-5 % Unemployed
• Natural Rate of Unemployment (NRU) 4-5% 
• Economy producing at its full potential

Why is unemployment bad?
1) Not enough consumption (GDP) 
2) Too much poverty 
3) Too much government assistance 

Why is unemployment good?
1) There is less pressure to raise wages
2) There is more workers available for future expansions 

Okun's Law: every one percent of unemployment above the NRU causes a 2% decline in real GDP

Sunday, January 11, 2015

Unit 1 (PPG, Demand, Supply)

Macroeconomics: the study of the major components of the economy
ex. inflation, GDP, international trade
Microeconomics: the study of how households and firms make decisions and how they interact in markets
ex. supply and demand, market structures


Positive Economics: claims that attempt to describe the world as is. very descriptive. fact.
ex. Minimum wage laws causes unemployment
Normative Economics: claims that attempt to prescribe how the world should be. very prescriptive in nature. opinion-based.
ex. The government should raise the minimum wage.

Needs: basic requirements for survival
Wants: desires of citizens. (broader than needs)

Scarcity: the most fundamental economic problem facing all societies. It is basically satisfying unlimited wants with limited resources (permanent). 
Shortage: Situation where quantity demanded is greater than quantity supplied temporary).

Goods: tangible committees
  • Consumer Goods: goods that are intended for final use by the consumer. ex. chocolate, car
  • Capital Goods: items used in the creation of other goods. ex. factory machines, trucks

Factors of Production:
  1. Land - natural resources
  2. Labor - work force
  3. Capital
    • Human Capital - knowledge and skills; gain through education and experience
    • Physical Capital - human made objects used to create other goods and services
  4. Entrepreneurship - have to be an innovator & risk taker

Tradeoffs: alternatives that we give up whenever we choose one course of action over another. 
Opportunity Cost: the most desirable alternative given up by making a decision. 
      • guns v. Butter (govt spending money on war or food)
Production Possibilities Graph: shows alternatives ways to use resources. 
Productive Efficiency: producing at the lowest cost, allocating resources efficiently, and having full employment of resources. (Any point in the curve)
Allocative Efficiency: where to produce on the curve; trying to find the best combination possible

5 Key Assumptions with PPG:
1) Two goods are produced
2) Full Employment
3) Fixed Resources (Land, Labor, & Capital)
4) Fixed state of technology
5) No international trade

- (B, D, C) Any point on the curve is productively efficient and attainable. 
- (A) Points inside the curve are considered "underutilization." They are attainable, but inefficient. Could be caused by decrease in population, recession, war, famine, underemployment, etc.
- (X) Points outside the curve are unattainable. Could be reached through economic growth, new technology, and new resources.

Full Employment (FE):
- Not 100% employment
- Not 100% productive
- ≈ 4% unemployment
- ≈ 80% factory capacity

Curve shift to the right = Increase in Demand
Curve shift to the left = Decrease in Demand
Straight Line Curve = Constant Opportunity Cost
Concave Possibilities Curve = Increasing Opportunity Cost

Demand

Demand: the quantities that people are able and willing to buy at various prices
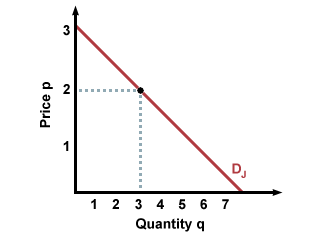
The Law of Demand: there is an inverse relationship between price and quantity demanded. When price increases, quantity decreases. When price decreases, quantity increases. (Demand Curve goes down)


What causes a "change in quantity demanded"? (∆ QD)
∆ in Price

What causes a "change in demand"? (∆ D)

  1. ∆ in buyer's taste (advertising)
  2. ∆ in number of buyers (population)
  3. ∆ in income
    • Normal Goods: goods that buyers buy more of when their income rises
    • Inferior Goods: goods that buyers buy less of when their income rises
  4. ∆ in price of related goods
    • Substitute Goods: goods that serve roughly the same purpose to buyers. ex. coke & pepsi
    • Complimentary Goods: goods that are often consumed together. ex. care & gas, fries & ketchup
  5. ∆ in expectations (thinking of the future)
Elasticity of Demand: tells how drastically buyers will cut back or increase their demand for a good when the price rises or falls
  • Elastic Demand: demand will change greatly given a small change in price (wants)
    • E > 1
    • Ex. movie tickets, steak, fur coats
  • Inelastic Demand: demand for a product will not change regardless of price (needs)
    • E < 1
    • Ex. milk, gasoline, medicine
  • Unit Elastic: E = 1
How to Calculate Price Elasticity of Demand (PED)
  1. (New Quantity - Old Quantity) ÷ Old Quantity
  2. (New Price - Old Price) ÷ Old Price
  3. abs(% ∆ in Quantity) ÷ abs(% ∆ in Price)

Supply

Supply: the quantities that producers or sellers are willing and able to produce or sell at various prices
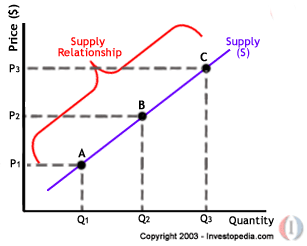
The Law of Supply: There is a direct relationship between price and quantity supplied. As price increases, quantity increases. As price decreases, quantity decreases. (Supply curve goes up)

What causes a "change in quantity supplied"? (∆ QS)
∆ in Price

What causes a "change in supply"? (∆ S)
  1. ∆ in weather
  2. ∆ in technology
  3. ∆ in taxes or subsidies (money the government gives you)
  4. ∆ in cost of production
  5. ∆ in number of sellers
  6. ∆ in expectations

Equilibrium: a point at which the supply curve and the demand curve intersect (economy is using their resources efficiently)
  • Price Ceiling: Government imposed limit on how high you can be charged for a product or service
    • Below the equilibrium point
    • Ex. Rent Control
  • Price Floor: Government imposed minimum on how low a price can be charged on a product or service
    • Above the equilibrium point
    • Ex. Minimum Wage
Marginal Revenue: the additional income from selling one more unit of a good
Fixed Cost (TFC): a cost that does not change no matter how much is produced
Variable Cost: a cost that fluctuates

Total Cost = TFC + TVC
Marginal Cost = New TC - Old TC
Average Fixed Cost = TFC ÷ Quantity
Average Variable Cost = TVC ÷ Quantity
Average Total Cost = AFC + AVC or TC ÷ Quantity


Shortage: QD > QS
Surplus: QS > QD